The THS Dashboard
The THS Dashboard
The Dashboard is a spreadsheet that contains over 1500 rows of data that accumulate information over time to demonstrate your current and past performance against a range of key metrics covering:
- Demographics (list size, age groups, care home residents)
- AF & anticoagulation
- BP & Hypertension
- Diabetes
- DMARD monitoring
- High risk drug monitoring
- Lipids
- Prescribing metrics Frailty
- CKD
- Respiratory: Asthma /COPD
- Frailty and care home data
- PSA monitoring
- MGUS monitoring
- Recall status
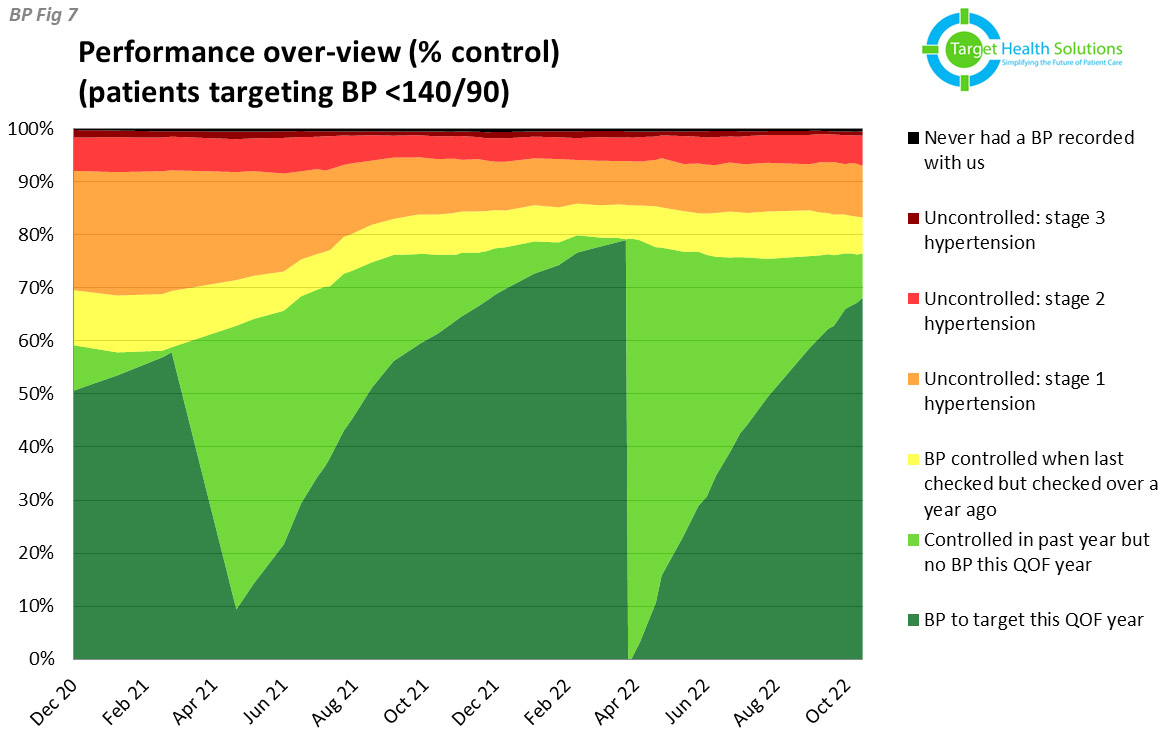
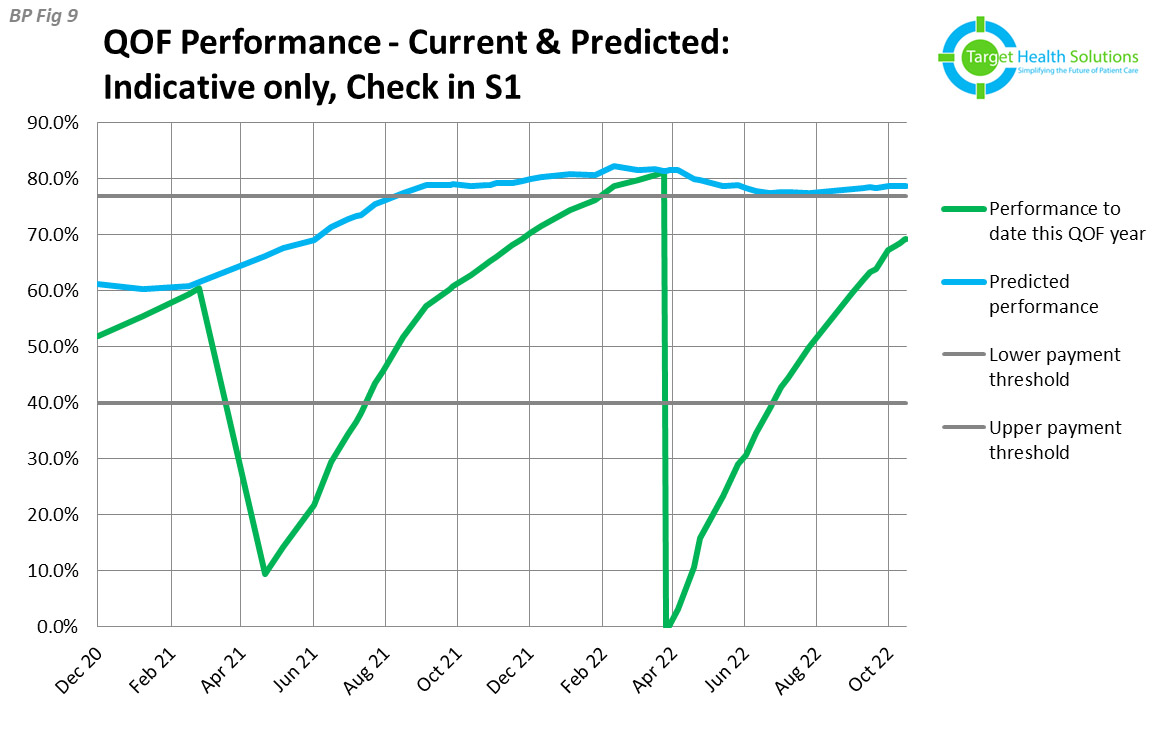
The numbers are useful for precision/audit/publications but all the data is also presented in a graphical format for easy reference. The sample charts on this page showcase how the Dashboard displays hypertension performance.
Data Intelligence Support
When you sign up to this pilot THS will help you and your teams understand the dashboard. Highlighting areas you need to focus on and those that should resolve themselves with use of the THS recall system. This data intelligence support is key to helping you maximise your income from QOF and IIF, we will also use data on the funding envelope for each QOF /IIF domain to help you target your attention. There are some common themes we anticipate with weaknesses in reviews for heart failure and dementia and edoxaban switches – these are key areas that provide significant income and THS has developed specific tools to help you achieve in these areas in the most cost effective way possible.
Confidential information and data protection considerations
THS differs from most PHM tools in that it does not export any patient level data from the clinical record. The dashboard consists purely of statistical data (numbers of patients in a specific group) and there is the option to apply type I and national data opt-outs prior to exporting the data. This makes this a low risk activity but even so we have a 10,000 word DPIA that has been through the local DELT Data Protection team.
Sample charts displaying hypertension performance
CQC Inspections
The Dashboard also contains reports that can help with CQC inspections – reports and charts to show case any safety issues and allow you to take action to address these. In most cases this is automated through the THS recalls process but some may warrant targeted review.
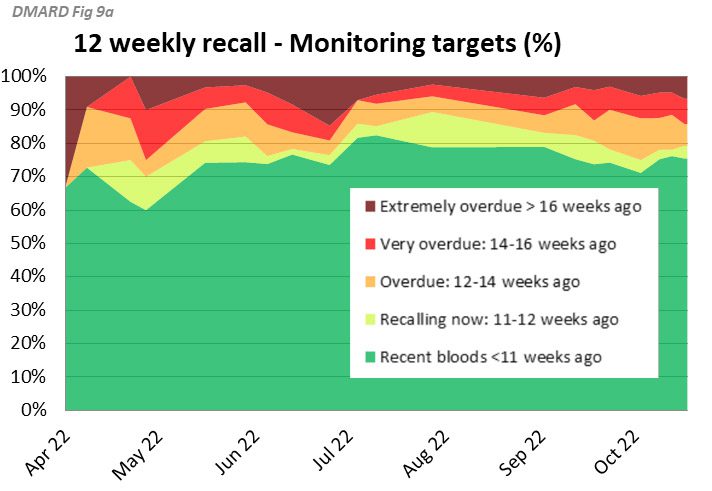
For example the chart here shows performance against 12 weekly /3 monthly recalls for DMARD monitoring:
